How rare was the recent wind lull? February–April 2026 Wind Drought Analysis.
Assess the severity of wind scarcity across Europe with our latest Wind Drought Map. Understand if the recent drop in production was a seasonal variation or a 1-in-10-year historical anomaly.
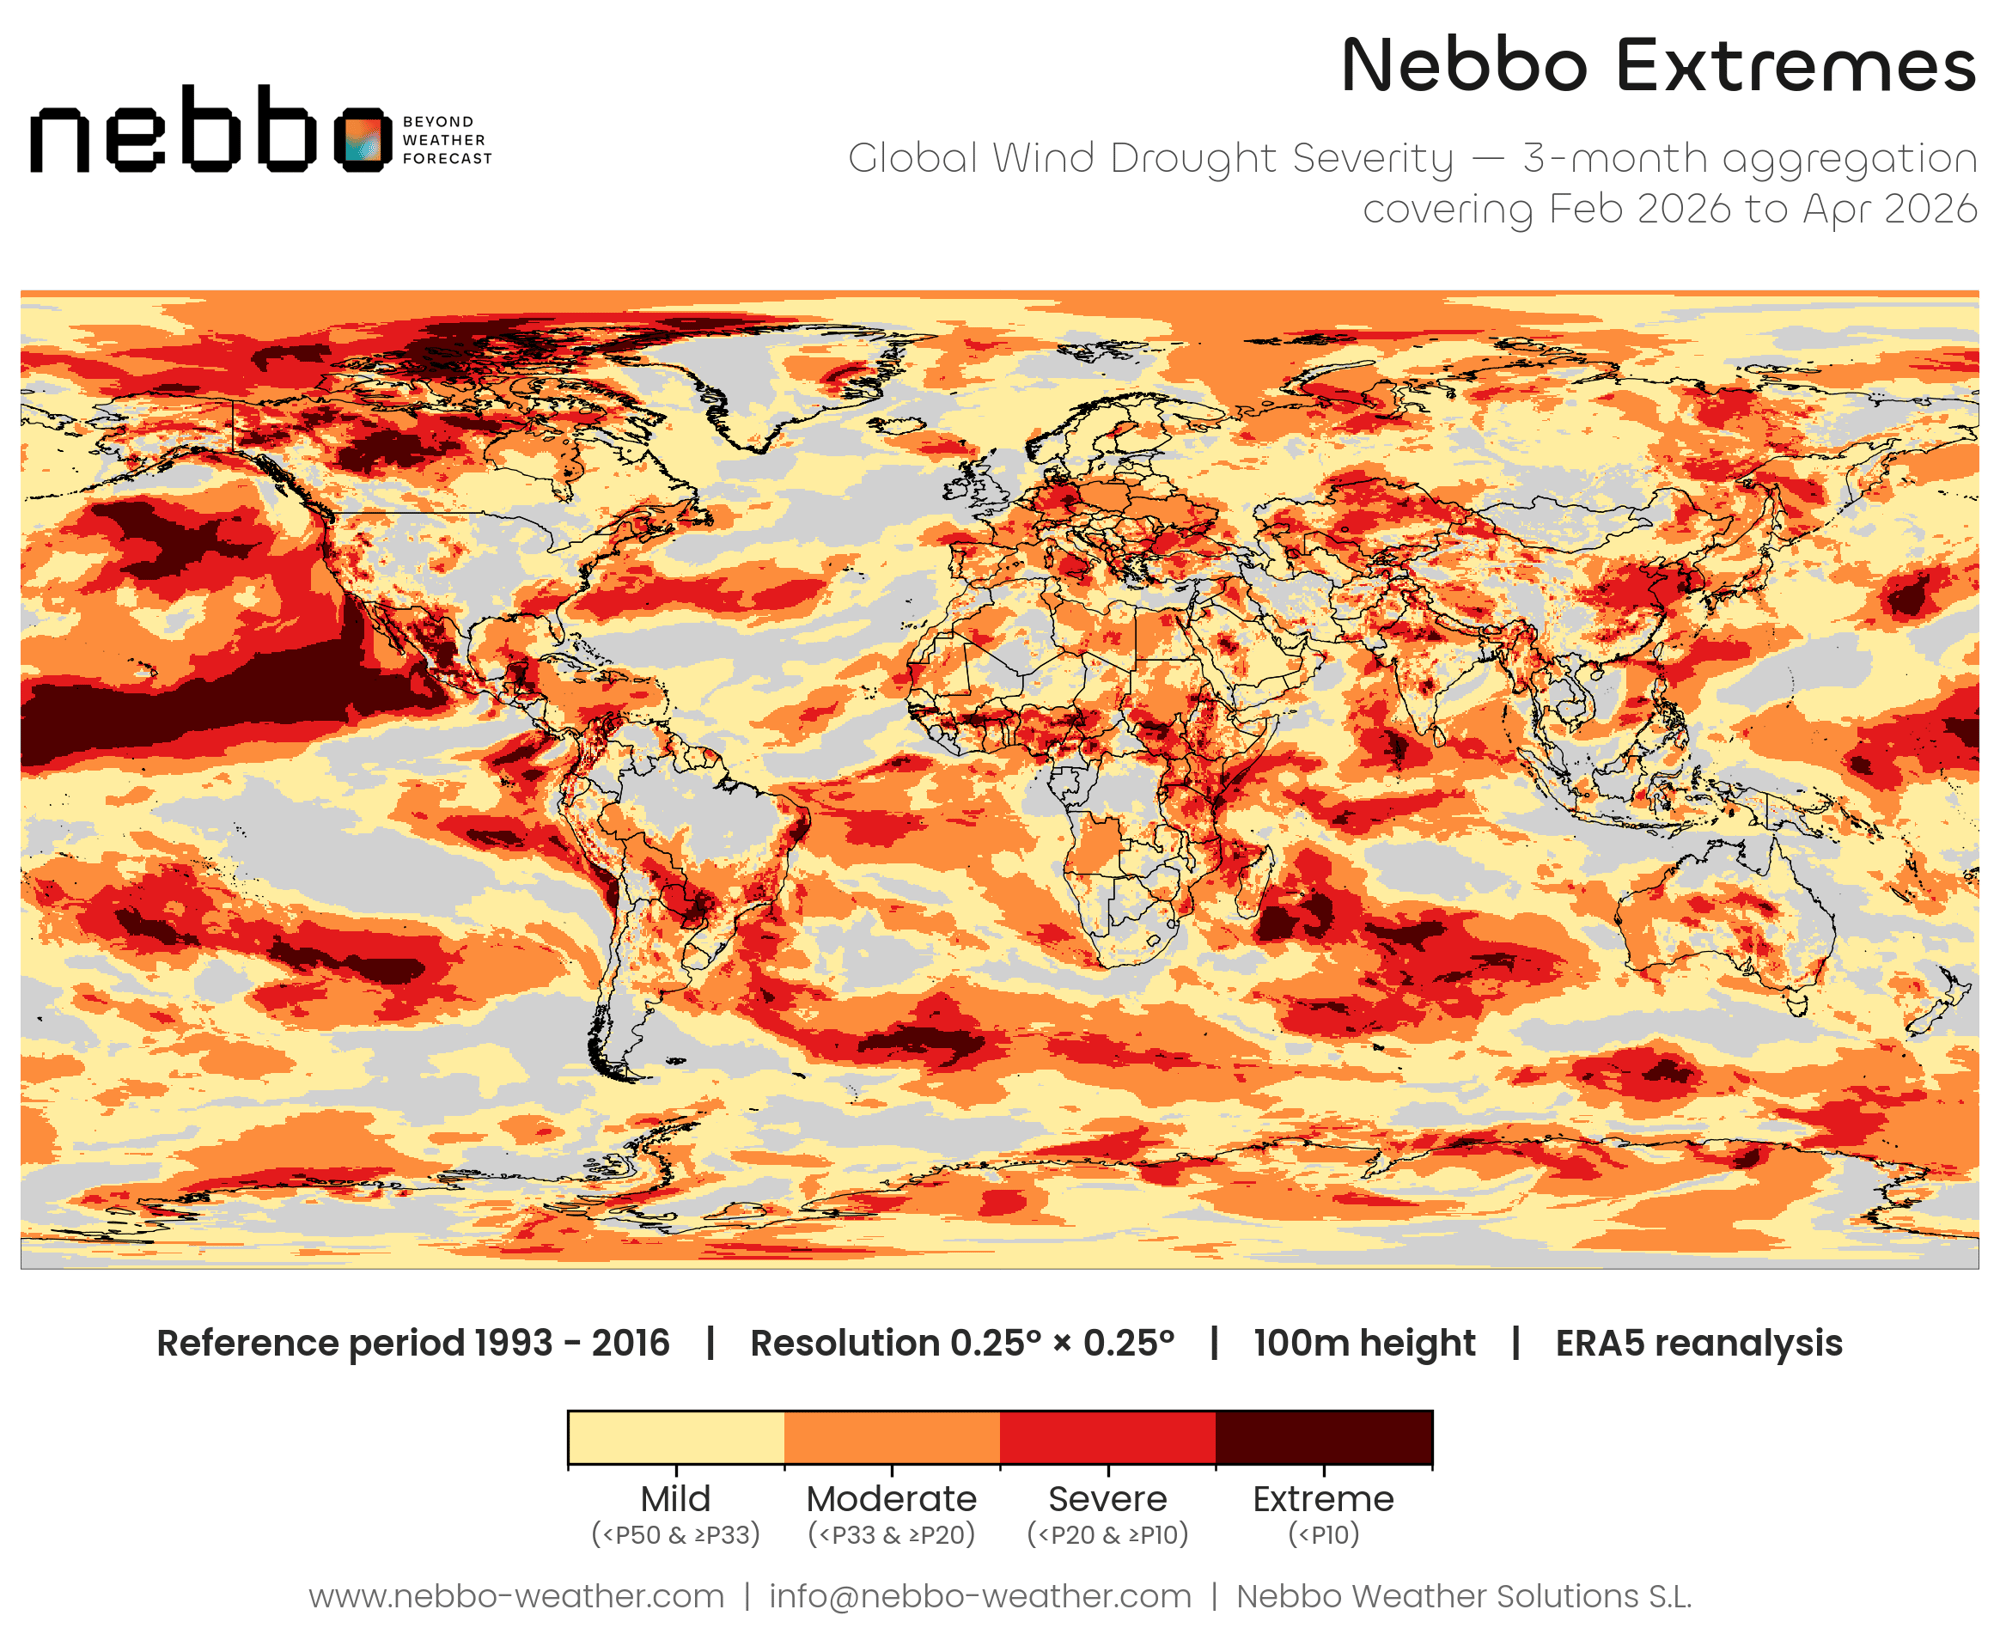
- Quantify Rarity: identify areas experiencing "Extreme" droughts (below the P10 threshold).
- Historical Context: see how the last 3 months compare against the 1993–2016 climatology.
- Weighted Insights: our methodology prioritizes the most recent data to reflect current operational challenges.
- Strategic Decision Making: use high-resolution data to explain production gaps to stakeholders.
Understanding the Wind Drought Scale
Our analysis uses a "ladder of rarity" to categorize how unusually low the wind has been. The scale reflects the historical probability of such events:
-
- Mild: historical occurrence of 1 in 6 times.
- Moderate: historical occurrence of 1 in 8 times.
- Severe: historical occurrence of 1 in 10 times.
- Extreme (Deep Red): events expected only a couple of times per decade. These represent the worst end of the historical distribution (below P10).